
Wattlas
US datacenter intelligence. It shows which datacenter megawatts are real, and every stage and figure links to its filing.

- Role Solo, with coding agents.
- Stack Python, SQLite, Claude CLI, Astro, Cloudflare.
- Year 2026
Announced isn't built. Wattlas reads 444,429 public records and shows US datacenter megawatts by stage, with the filing behind every figure.
Megawatts by stage
Announced, requested, approved and energized stay apart. When two filings disagree, you see both. Unknown stays unknown.
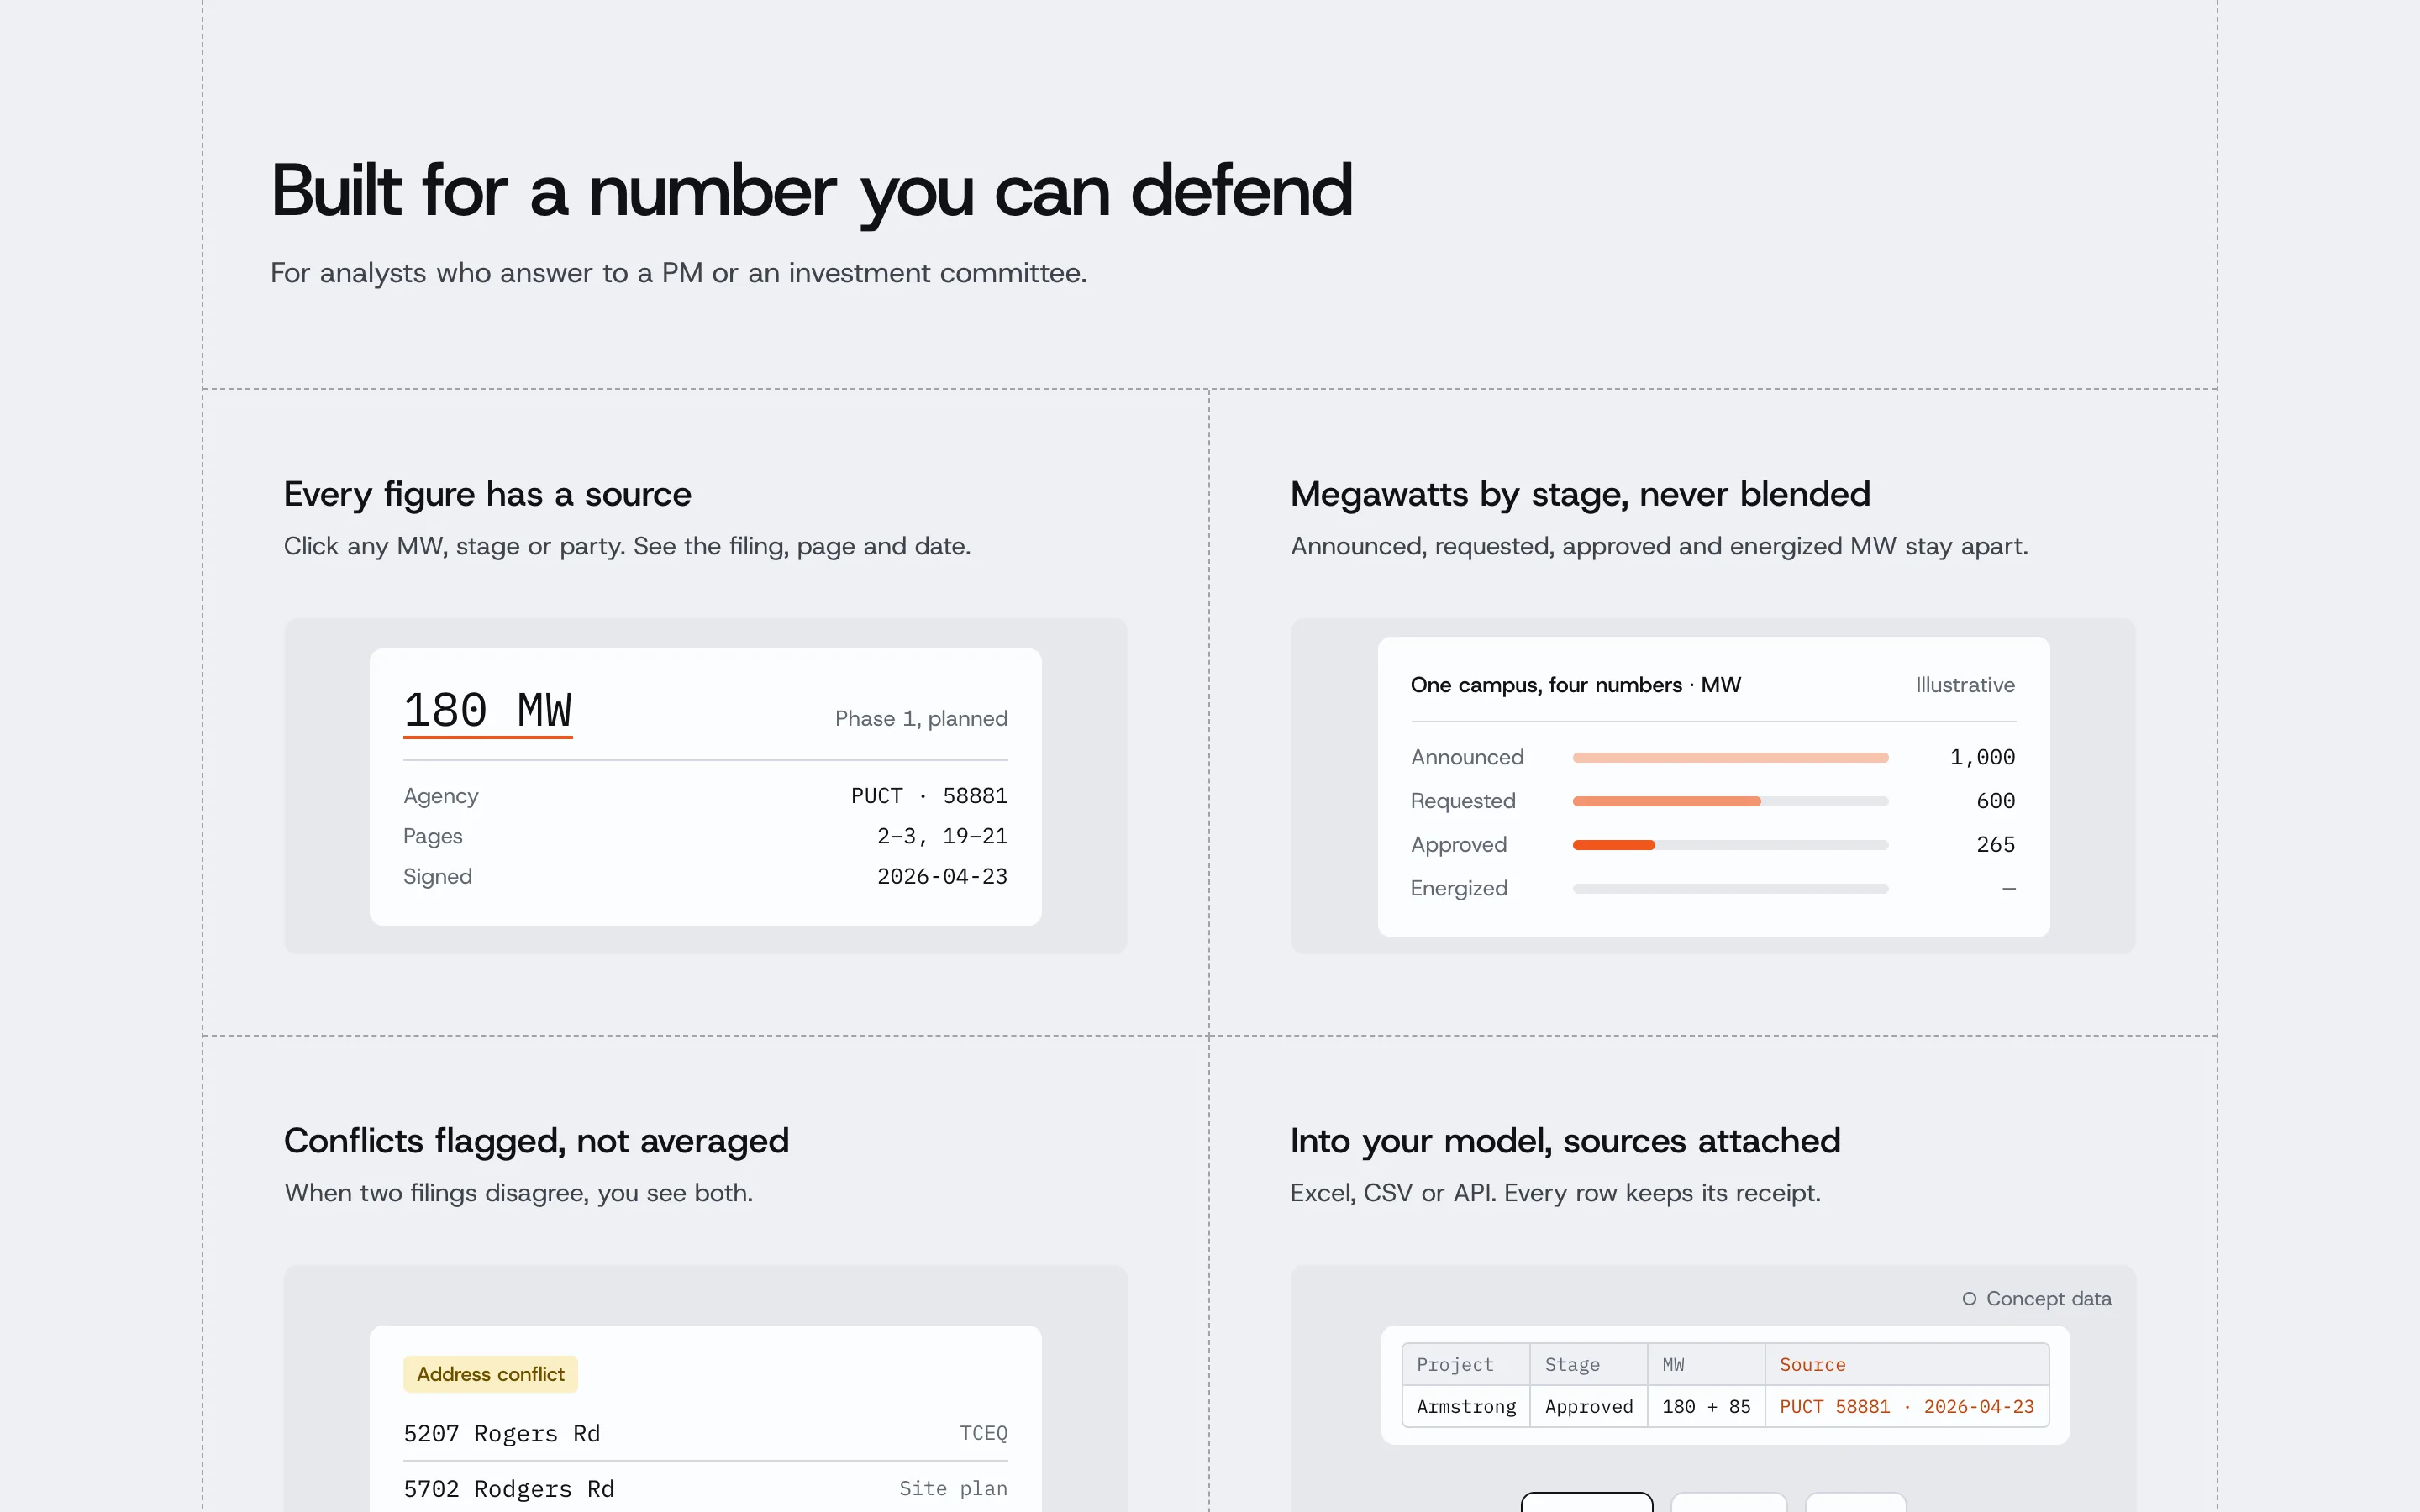
A receipt on every number
Each building and phase gets its own evidence card, and each claim is cited to its page, scanned PDFs included.
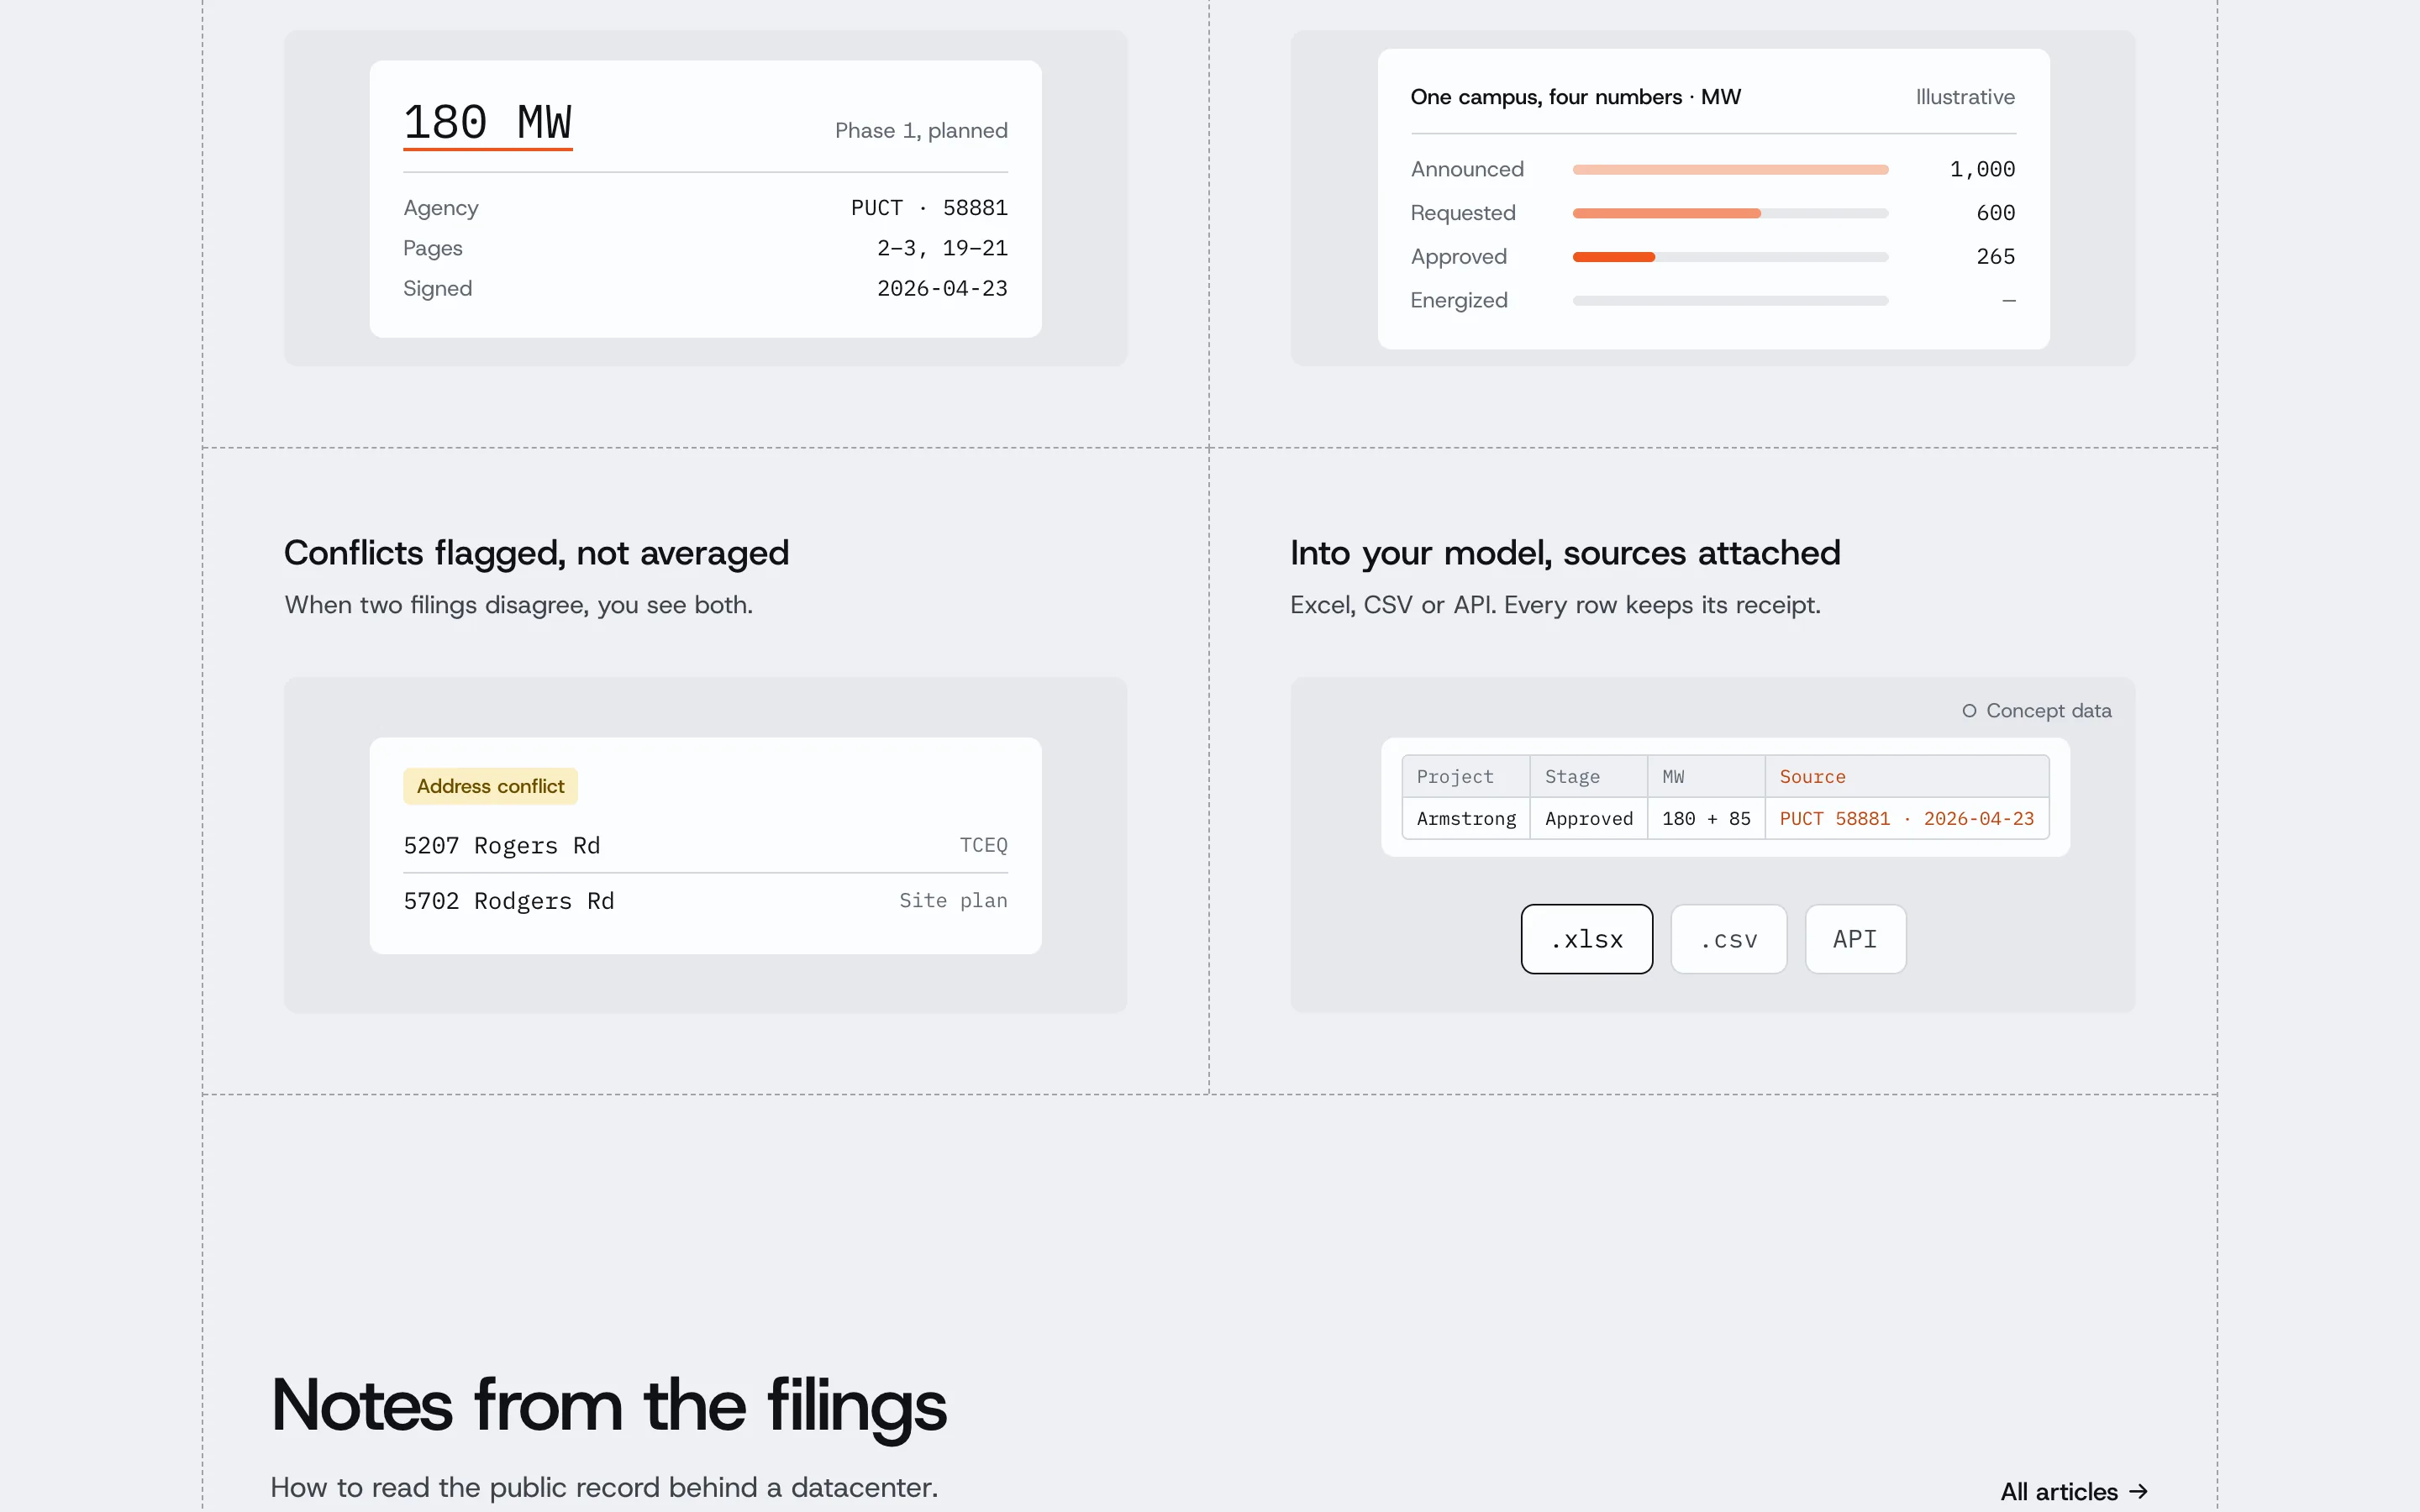
National breadth
About 240 county agenda portals, plus FAA, EPA, state permits, utility queues and tariffs.
Brand
- Aa Host Grotesk Site
- Aa IBM Plex Mono Figures, dates, receipts
- #EEF0F3
- #101216
- #F0561D
- #F49470
- #F7C4AE
- #E8B10A
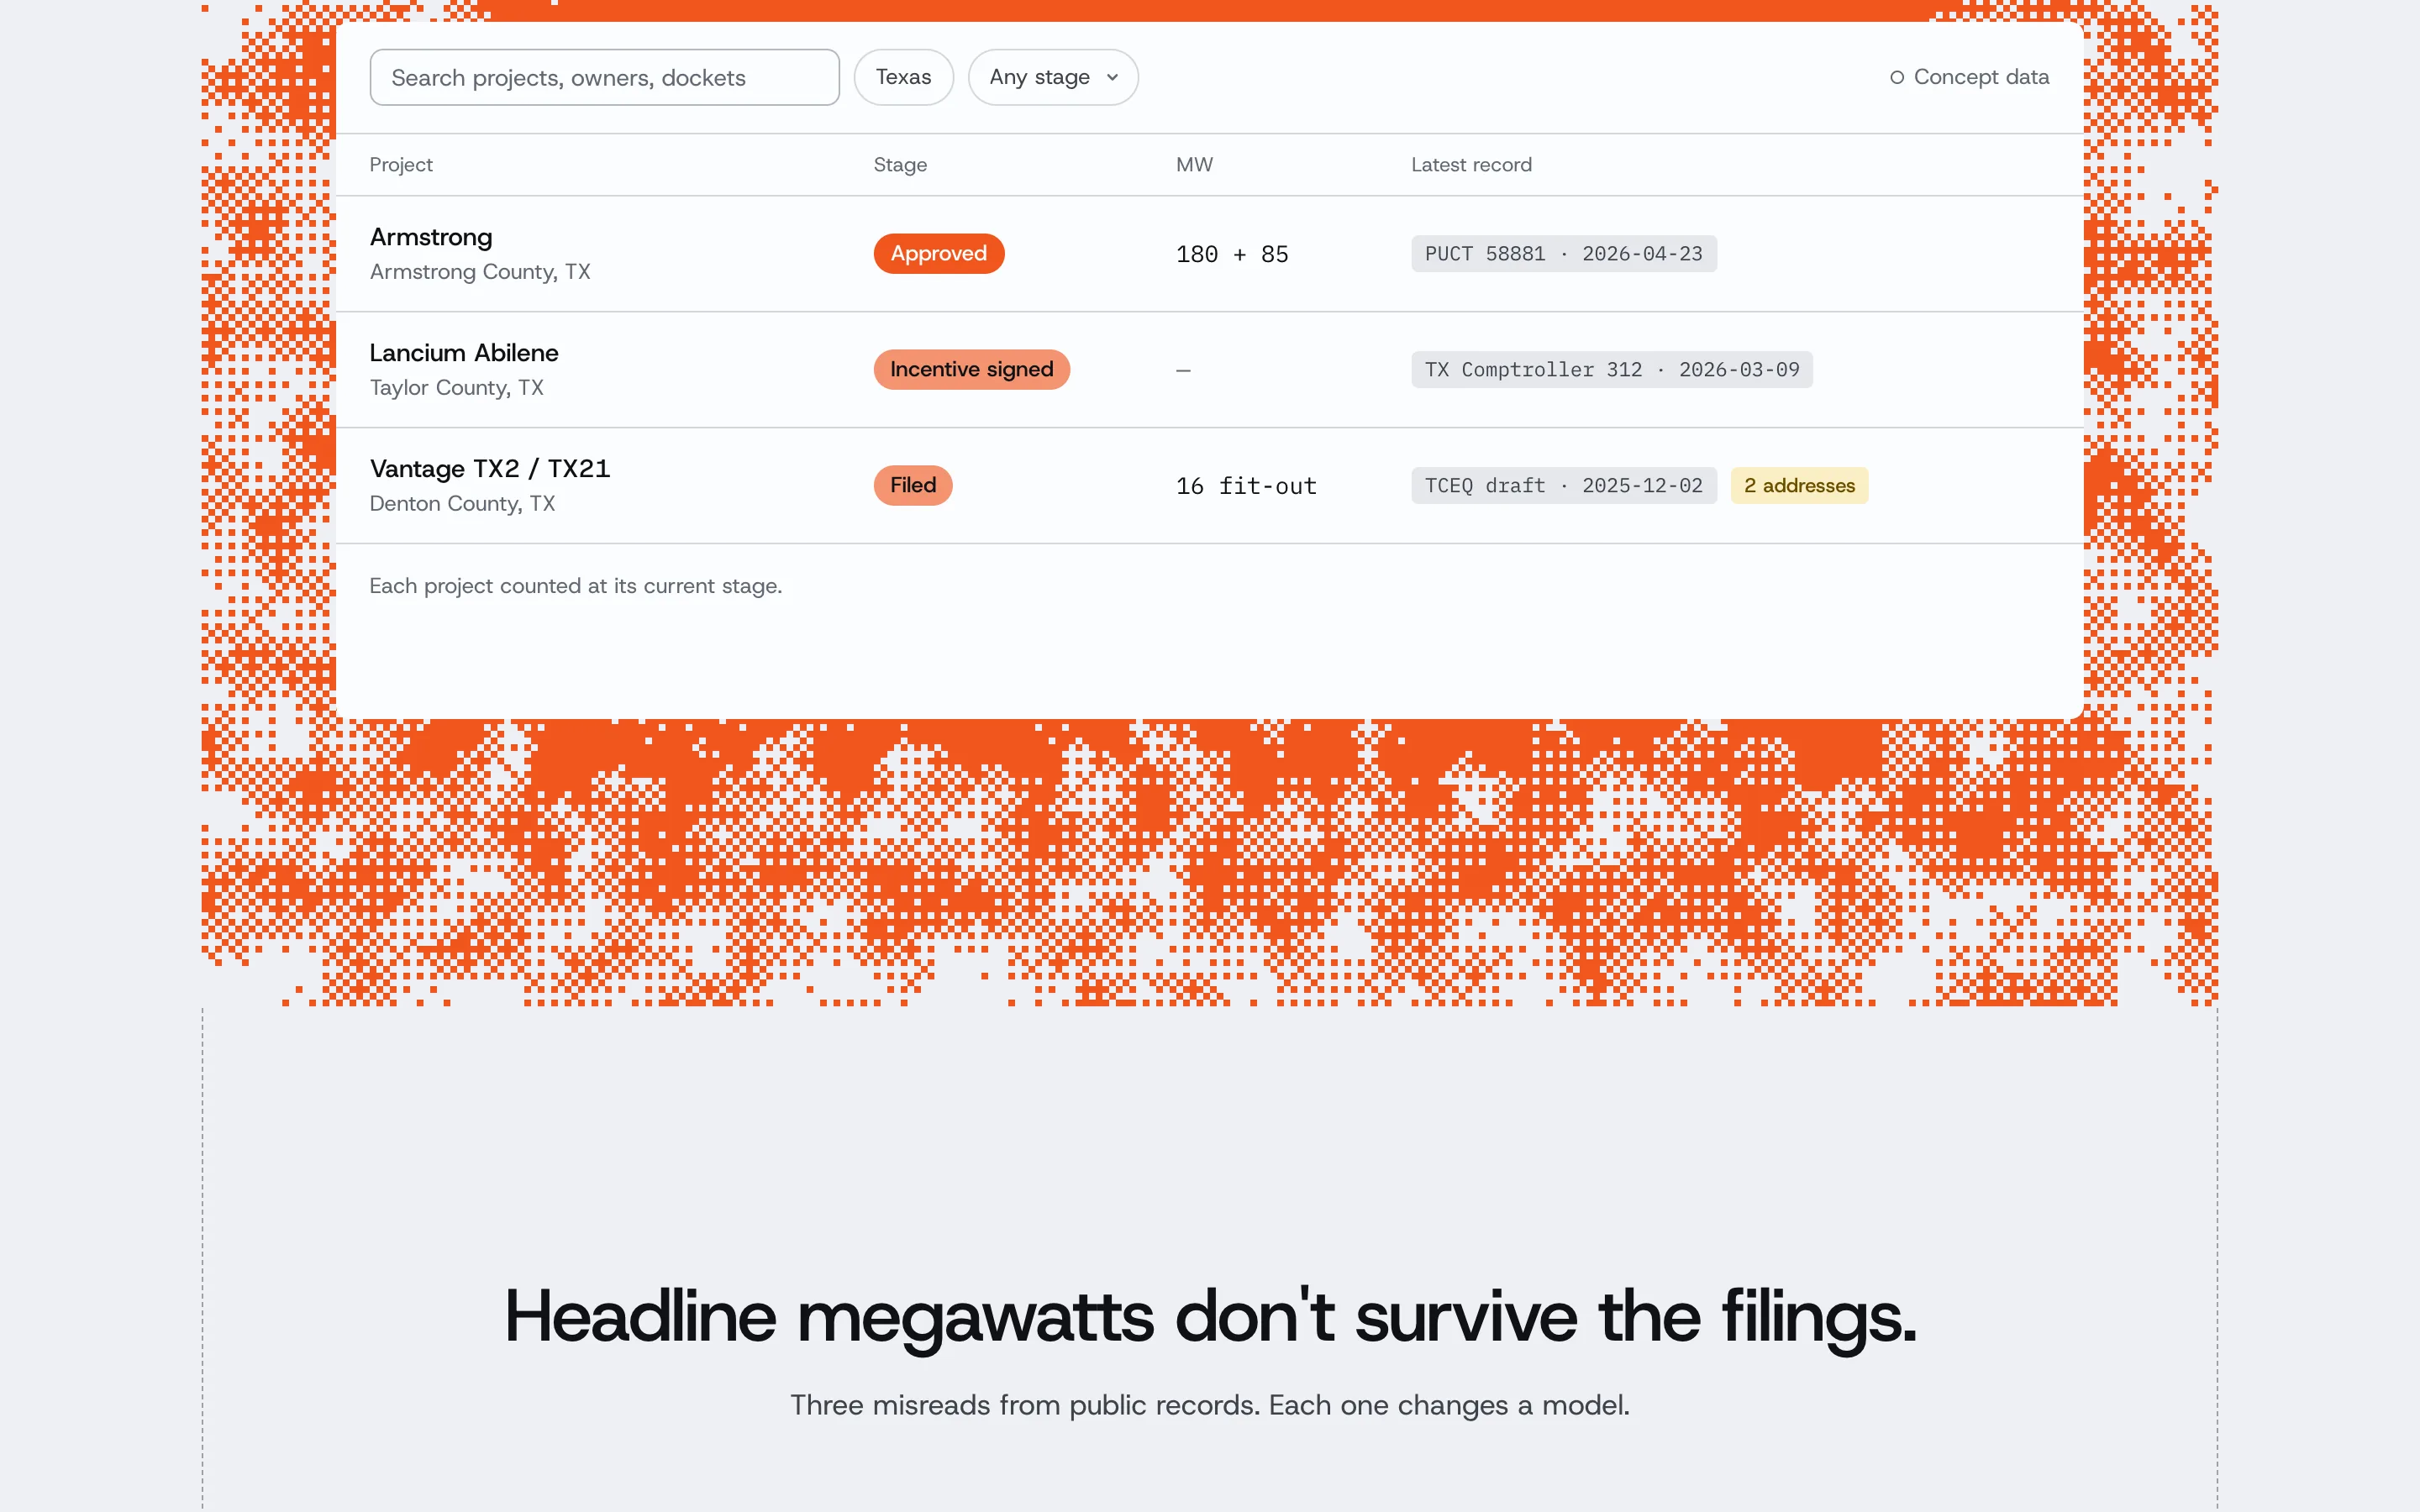
Orange saturation is strength of proof: vivid is firm, pale is early, grey is stalled. Yellow is a conflict.
Result
- wattlas.io is live. The table on its home page is concept data, and says so.
Have a project in mind? Describe it below for a quote within a day, or email me. My own apps live at deeflect.com.